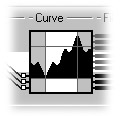
The Curve section is where you can further model the signal which is being sent
from the source object to the destination object. It is also the
place where you define the possible limits of the destination object. The Curve section is where you can further model the signal which is being sent
from the source object to the destination object. It is also the
place where you define the possible limits of the destination object.
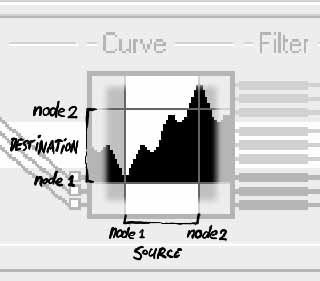
The curve should be read similarly to a Gamma curve, or a curve
in Photoshop. The horizontal axis is the input signal, or the
data as it comes from the source object, and the vertical axis
is the output signal, or the data as it is sent to the destination
object. In the Puppeteer interface, you'll see a narrow white
band in the background of the curve, as well as some dark grey
lines running through it. These define the axis system of the
curve, and can be directly translated to the first and second
node's values (see illustration below). Furthermore, the curve
works on each and every active channel by the same amount, not
just on one of them. |
|
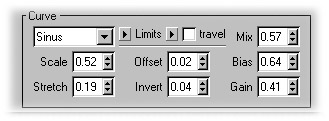
There are a few types of curves, each with their own settings.
But for all types of curves, you can adjust the scale, the stretch,
the offset and the inversion.
Scale scales the curve vertically. A scale value of 1.0 means that
the curve isn't scaled. With 2.0 the curve will be twice as high.
Stretch scales the curve horizontally. Again, a value of 1.0 will mean
that the curve isn't stretched, while a value of 0.5 will mean
that it is shrunk to half the size. Logically, you can't put the
Stretch value on 0.0.
Offset moves the curve from left to right. A value of 0.0 means no difference
at all. If you set it to 1.0, the curve will have moved by exactly
the width of t he axis system, in other words the width of the
narrow width band in the curve display.
With Invert you can flip the curve vertically. If Invert is on a value of
0.0, the curve will display normally. Put the setting on 1.0 and
it will be exactly flipped vertically. You can also use negative
numbers or numbers bigger than 1.0 in Invert, allowing you to
scale the curve vertically just like the Scale setting, though
with the origin of scale being in a different place. With Scale,
you scale from the bottom of the graph. With Invert, you can scale
from the middle of the graph outwards.
In the popup menu of the curve settings, you can select the type of curve you want to use. There are five possibilities: Step, Linear,
Bias, Gain and Sinus.
The Step curve is kind of a on/off switch. It simply switches from one
value to the next at a certain point. By default, this is at the
right side of the graph, where the input equals node 2. But of
course you can move this point around with the various settings
described above.
The Linear curve is also pretty straightforward. It simply doesn't do a
translation at all! It feeds the input directly to the output.
Only when you modify the curve with the above settings, the output
will differ from the input. You can use this curve to easily change
the amount of influence the source object has on the target object
without the need to touch the nodes.
The Bias curve is the raw implementation *) of Cinema4D's Bias function (output=input^(log(bias)/log(0.5))).
If you set the Bias value to anything other than 0.5, the curve changes sharply at one
end, and just a little on the other end. Ideal if you want a certain
move of the source object have more (or less) influence the further
you move it. You can mix between the bias and linear curve with
the Mix value.
The Gain curve is the raw implementation *) of Cinema4D's Gain function (output=(input<0.5) ? (Bias(1-gain,2*input)/2)
: (1.0-Bias(1-gain,2-2*input)/2)). By changing the Gain value, you can either get a curve which changes less at the ends and
more in the center, or more in the center and less at the ends.
Ideal for a quick and dirty ease-in and -out effect. Again, use
the Mix value to mix between the linear curve and the Gain curve.
The Sinus curve is the most flexible of all. With the default settings,
it uses the sine function to do a perfect ease-in and ease-out
at the ends of the curve. You can also use both the Bias and Gain values to change the curve in a similar way as the Bias and Gain
types. The difference is that, with the Sinus type, the Bias and
Gain curves have their influence limited to the area between the
edges of the curve, preventing the curve from popping into infinity.
If you change the Bias for example, while leaving all other settings
at their defaults, you'll see that beyond the left and right edges
of the curve, the curve is displaying the pure Sine function.
If you want the Bias or Gain effect to extend beyond the edges,
you'll have to set the limits of the curve to Loop or Ping-pong.
With the Mix value in Sinus-curve mode, you can mix away just the Sine function,
leaving you with a linear curve on which you can still change
both the Bias and Gain. The best way to figure out how these two
combine is by trying them out in the Puppeteer interface. The
curve display will probably explain a lot more than I can put
into words.
|
|
The other thing you define in the Curve settings is the way the
data flowing from the source object into the target object is
treated if it goes beyond the borders set by the two nodes. If
the source object's first node has an X position of 0m, and it's
second node has an X position of 100m, what should happen if the
source object is at an X position of 150m, or -234m? That is what
the Limits are for. Directly next to the Curve popup-menu (where you set
the curve type) there are two little arrows. Clicking these will
provide you with a little menu with four options, which are the
four types of limits you can set to the data. The left menu is
used for the limit at node 1, or the left side of the curve, and
the right arrow is used to set the limit at node 2, or the right
side of the curve. The curve display will update accordingly.
There are four types of limits you can set, and both ends can
have a different limit. The types are: None, End, Loop and Ping-pong.
None will simply not put any limits on the data. End will keep the value it finds at the edge of the curve, and feed
that through to the destination object if the source object goes
beyond the limits set in the nodes. Loop works just like looping an animation playback: it will simply
repeat the curve between the limits endlessly. Finally, Ping-pong will also repeat the curve, but alternate between a mirrored
curve and a normal curve, just the way the pure sine function
does. Again, the best way to get to grips with these settings
is to try them out and watch the curve-display in the Puppeteer
interface update.
If you have Feedback turned on in the source object's coordinates section, setting
the limit(s) to End will also affect the movement of the source
object, taking care that the object doesn't go beyond the borders
defined in the nodes. Logically, setting the limit(s) to Loop
or Ping-pong means that the source object should be able to go
beyond the limits, else the settings wouldn't make sense at all
since there wouldn't be anything to Loop or Ping-pong.
There is an extra setting next to the limits, which is called
Travel. This is built in because you can treat the limits in two ways
if you change the Offset, and move the curve from side to side.
Either you let the limits travel along with the Offset, or you
keep the limits in a fixed position, and let the curve move 'beneath'
it. That is what the Travel setting does. Turn it on, and the
limits move along if you change the Offset. Turn it off and the
limits and their effect stay in a fixed spot at the edges of the
white region in the curve-display, while the curve itself moves
from side to side.
|